Small businesses don’t need enterprise analytics. In fact, most small business owners waste hours each week staring at metrics that have zero impact on revenue. The secret to effective small business analytics isn’t tracking more — it’s tracking less, but tracking the right things.
This guide cuts through the noise. You’ll learn exactly which metrics drive growth for small businesses, which ones to ignore completely, and how to set up a simple analytics stack that costs under $15 per month.
The Small Business Analytics Problem
Google Analytics gives you 200+ reports. However, small businesses need answers to roughly five questions. This mismatch causes two common problems: either you spend too long in analytics dashboards without acting on anything, or you avoid analytics entirely because the complexity is overwhelming.
Moreover, GA4’s learning curve has gotten steeper while its data accuracy has declined. Between ad blockers, cookie consent rejection, and data sampling, the numbers in your GA4 dashboard may be off by 30-50%. Consequently, many small businesses are leaving Google Analytics for simpler, more accurate alternatives.
The goal of small business analytics is straightforward: understand what’s working, stop what isn’t, and make decisions faster. Everything else is noise.
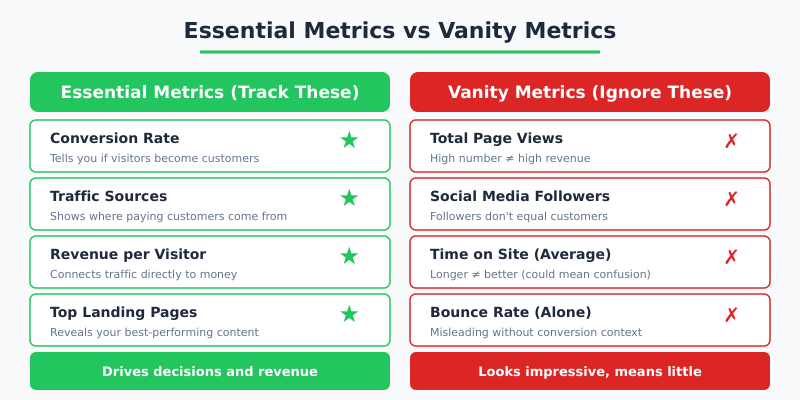
Essential Metrics: What Every Small Business Should Track
These are the metrics that directly connect to revenue and growth. Therefore, they deserve a spot on your dashboard.
1. Conversion Rate
Your conversion rate is the single most important metric for any small business website. It tells you what percentage of visitors take your desired action — whether that’s making a purchase, filling out a contact form, or booking an appointment.
A typical small business website converts at 2-5%. If yours is below 2%, fixing your conversion rate will generate more revenue than doubling your traffic. In other words, conversion rate optimization gives you the most bang for your buck.
2. Traffic Sources
You need to know where your visitors come from. Not because the number matters, but because it tells you where to invest your limited marketing budget. Traffic sources break down into:
- Organic search: People finding you through Google
- Direct: People typing your URL or using bookmarks
- Referral: Links from other websites
- Social: Traffic from social media platforms
- Campaigns: Paid ads and email marketing (tracked via UTM parameters)
3. Top Landing Pages
Which pages do visitors arrive on first? This reveals what content attracts your audience and which pages need the strongest calls-to-action. Furthermore, top landing pages with low conversion rates represent your biggest optimization opportunities.
4. Goal Completions
Set up event tracking for every action that matters to your business:
- Contact form submissions
- Phone number clicks
- Email link clicks
- Product purchases
- Newsletter signups
- Download button clicks
5. Revenue Per Visitor
If you sell online, divide total revenue by total visitors. This single number tells you the monetary value of each visitor to your site. Consequently, you can calculate the exact ROI of any marketing activity that sends traffic your way.
Vanity Metrics: What to Stop Tracking
These metrics look impressive in reports but rarely drive business decisions. Therefore, stop spending time on them.
| Vanity Metric | Why It’s Misleading | What to Track Instead |
|---|---|---|
| Total page views | High views don’t equal high revenue; one person can create hundreds of page views | Unique visitors + conversion rate |
| Bounce rate (alone) | A “bounce” on a contact page may still result in a phone call | Goal completions from each page |
| Average session duration | Longer sessions may indicate confusion, not engagement | Pages per session + conversions |
| Social media followers | Followers rarely correlate with revenue for small businesses | Referral traffic from social that converts |
| Email list size | A large unengaged list is worth less than a small active one | Email click-through rate + conversions |
“If you can’t connect a metric to a specific business decision or revenue outcome within 10 seconds, it doesn’t belong on your small business dashboard.”
The Ideal Small Business Analytics Stack
You don’t need expensive tools or complex setups. Here’s a complete analytics stack that costs under $15/month and takes less than an hour to set up.
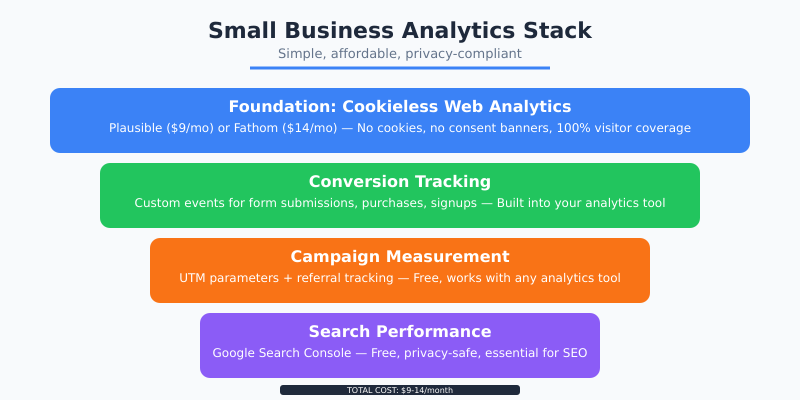
Layer 1: Cookieless Web Analytics ($9-14/month)
Choose one privacy-first analytics tool as your foundation:
- Plausible Analytics ($9/mo): Best for simplicity and API access
- Fathom Analytics ($14/mo): Best for EU businesses needing ironclad compliance
- Simple Analytics ($9/mo): Best for absolute minimalists
All three are cookieless, meaning you don’t need a cookie consent banner. Additionally, they capture data from visitors who would be invisible to Google Analytics due to ad blockers.
Layer 2: Conversion Tracking (Free)
Every privacy-first tool includes built-in event tracking. Set up custom events for your key conversion actions. This takes 15-30 minutes and requires adding a few lines of code or using tag attributes.
Layer 3: Campaign Tracking (Free)
Use UTM parameters on all marketing links. This is completely free and works with any analytics tool. As a result, you’ll know exactly which email campaign, social post, or ad drove each visitor.
Layer 4: Search Console (Free)
Google Search Console shows which search queries bring visitors to your site. It’s free, privacy-safe, and essential for understanding your organic search performance.

Setting Up Your Analytics in Under One Hour
Here’s a step-by-step timeline for getting your small business analytics running:
- Minutes 1-10: Sign up for Plausible or Fathom. Add the single-line script tag to your website header.
- Minutes 10-25: Configure 3-5 custom events for your most important conversions (form submissions, clicks, purchases).
- Minutes 25-35: Create UTM-tagged links for your active marketing channels (email signature, social profiles, ads).
- Minutes 35-45: Set up Google Search Console and verify your domain.
- Minutes 45-60: Bookmark your analytics dashboard and schedule a 15-minute weekly review.
That’s it. Your analytics stack is complete. However, the setup only works if you actually check it regularly.
The Weekly Analytics Review (15 Minutes)
Schedule 15 minutes each Monday morning. Follow this checklist:
| Check | Time | Action If Abnormal |
|---|---|---|
| Total visitors vs last week | 2 min | Investigate drops >20% |
| Top traffic sources | 3 min | Double down on top performers |
| Conversion rate | 2 min | Review landing page if below target |
| Top pages | 3 min | Optimize high-traffic, low-converting pages |
| Goal completions | 3 min | Check forms and CTAs are working |
| Search Console queries | 2 min | Note new keyword opportunities |
Tip: Set up email reports in Plausible or Fathom to receive weekly summaries automatically. This way, you’ll notice major changes even during busy weeks when you skip the manual review.
When to Level Up Your Analytics
Your basic stack is sufficient until you hit certain growth milestones. Therefore, consider upgrading when:
- Revenue exceeds $50K/month: Add a proper CRM to track customer lifetime value
- Marketing budget exceeds $2K/month: Implement cookieless conversion tracking for paid campaigns
- Team grows beyond 3 people: Create shared dashboards and automate reporting
- Content marketing becomes a priority: Add content-specific metrics like scroll depth and engagement scoring
Until you hit those milestones, a simple analytics stack gives you everything you need. Moreover, starting simple means you’ll actually use your analytics consistently rather than drowning in complexity.
Stop Overcomplicating It
The best small business analytics setup is one you actually use. Five metrics checked weekly will drive more growth than 50 metrics ignored monthly. Start with conversion rate and traffic sources. Add layers only when you need them.
Furthermore, privacy-first tools make this easier than ever. No cookie banners, no consent management platforms, no tag managers. Just a single script, a clean dashboard, and 15 minutes each week. That’s all any small business needs to make data-driven decisions that actually move the needle.