Conversion is the bridge between traffic and revenue. If you bring the right people to the right page with the right offer, they act—buy, subscribe, book a demo, start a trial. This article clarifies what is website conversion, how to compute your website conversion rate, and what to do with the number once you have it (no tool setup or implementation steps—just the strategy and math).
What counts as a conversion?
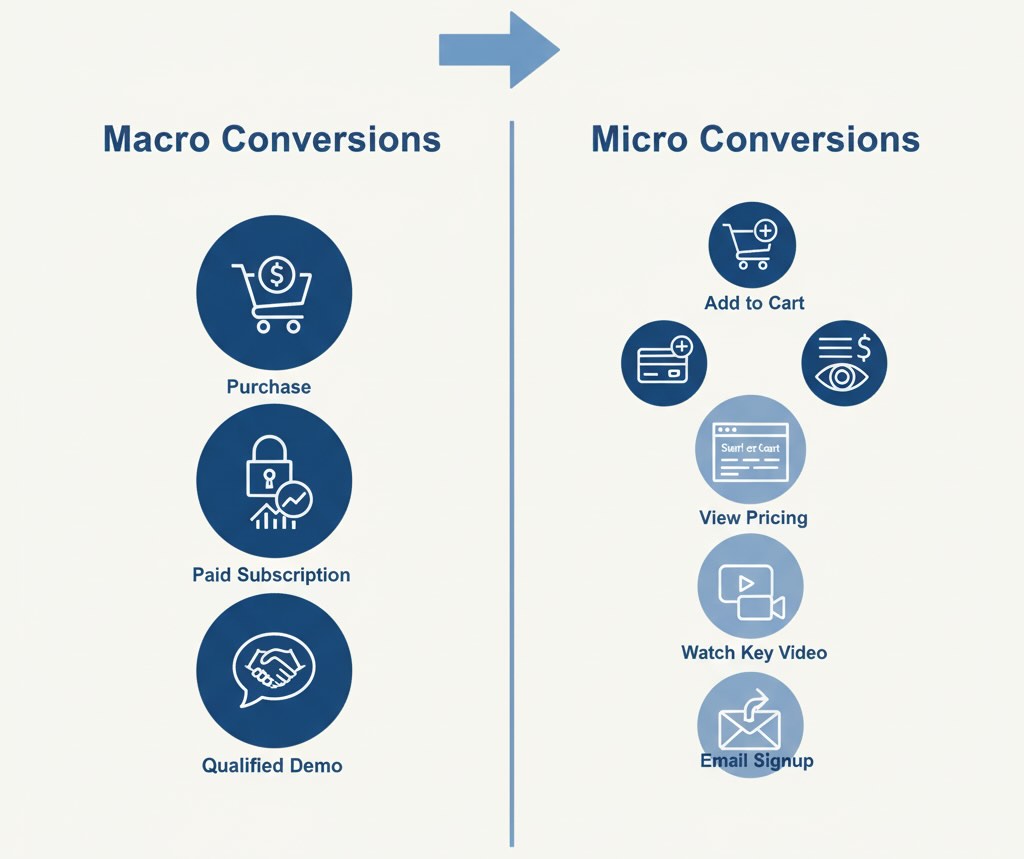
A conversion is a completed action that creates business value. For tracking organic search conversions without cookies, see our SEO analytics guide. Typical macro-conversions include a purchase, a paid subscription, or a qualified demo request. Micro-conversions are meaningful steps on the path—adding to cart, starting checkout, viewing pricing, watching a key video, or signing up for email. Use micro-conversions to spot friction early; use macro-conversions to tie marketing to revenue.
What is website conversion rate?
Your conversion rate is the share of visitors (or sessions) that complete a defined action. Put differently, what is website conversion rate? It’s a ratio that answers: “Out of all opportunities to convert, how many did?”
You can compute it per user or per session:
- User-based CR answers “How many people convert?” (good for products with longer consideration).
- Session-based CR answers “How many visits convert?” (useful for quick purchases and UX changes).
Pick one primary lens and stick with it for comparisons.
How to calculate website conversion rate
The basic formula is straightforward:
Conversion Rate = Conversions ÷ Opportunities × 100%
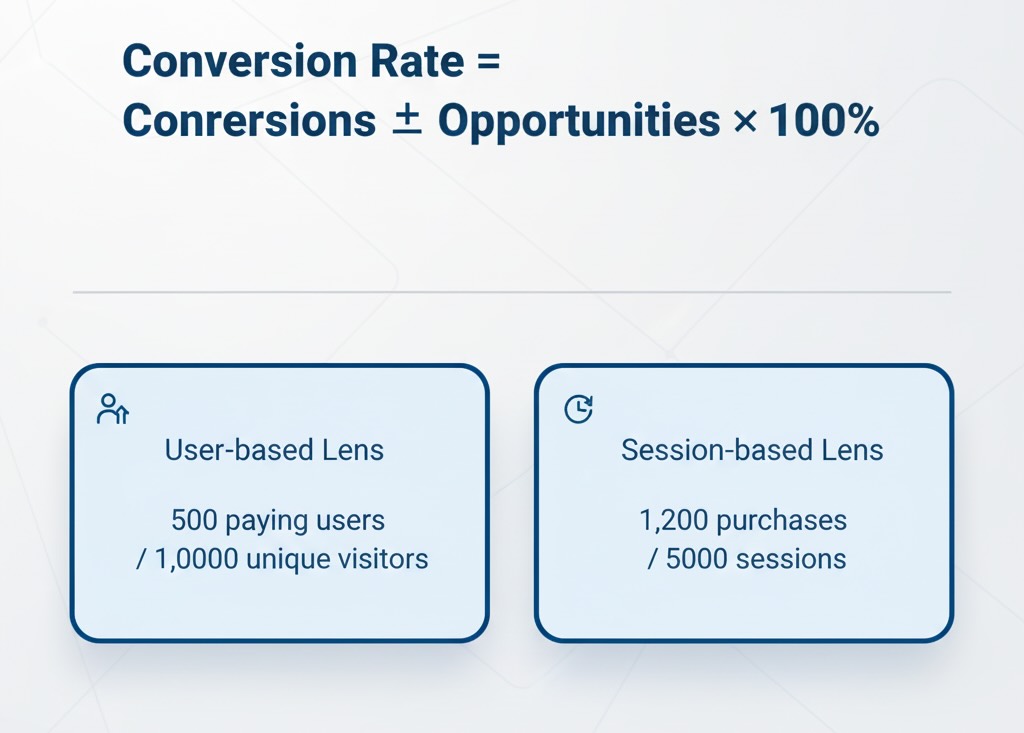
Where “Opportunities” are either users or sessions, depending on your lens.
Examples
- 96 purchases from 1,200 sessions → 96 ÷ 1,200 = 8%.
- 210 sign-ups from 3,500 users → 210 ÷ 3,500 = 6%.
To keep your math honest:
- Define a clear denominator (all sessions? only paid sessions? only new users?).
- Use a reasonable attribution window (e.g., 7–30 days for trials; same-session for impulse buys).
- Separate macro and micro rates so you can see where the funnel thins.
What is a good conversion rate for a website?
Industry benchmarks vary widely. According to WordStream research, the average landing page conversion rate is around 2.35%, with top performers hitting 5.31% or higher.
The honest answer: it depends—on intent, price point, friction, trust, and device. Asking what is a good conversion rate for a website is like asking, “What’s a good batting average?” Good is relative:
- Relative to your baseline last quarter.
- Relative to your unit economics (CR must support CAC and margin).
- Relative to segment norms (brand search vs. cold social clicks will never match).
A “good” rate is one that makes your growth mechanics work:
(CR × Average Order Value × Repeat Rate) – CAC – COGS ≥ Target Margin.
If that inequality holds for your priority segments, your conversion rate is good enough—optimize for profit, not a vanity percentage.
Don’t average away the truth: segment first
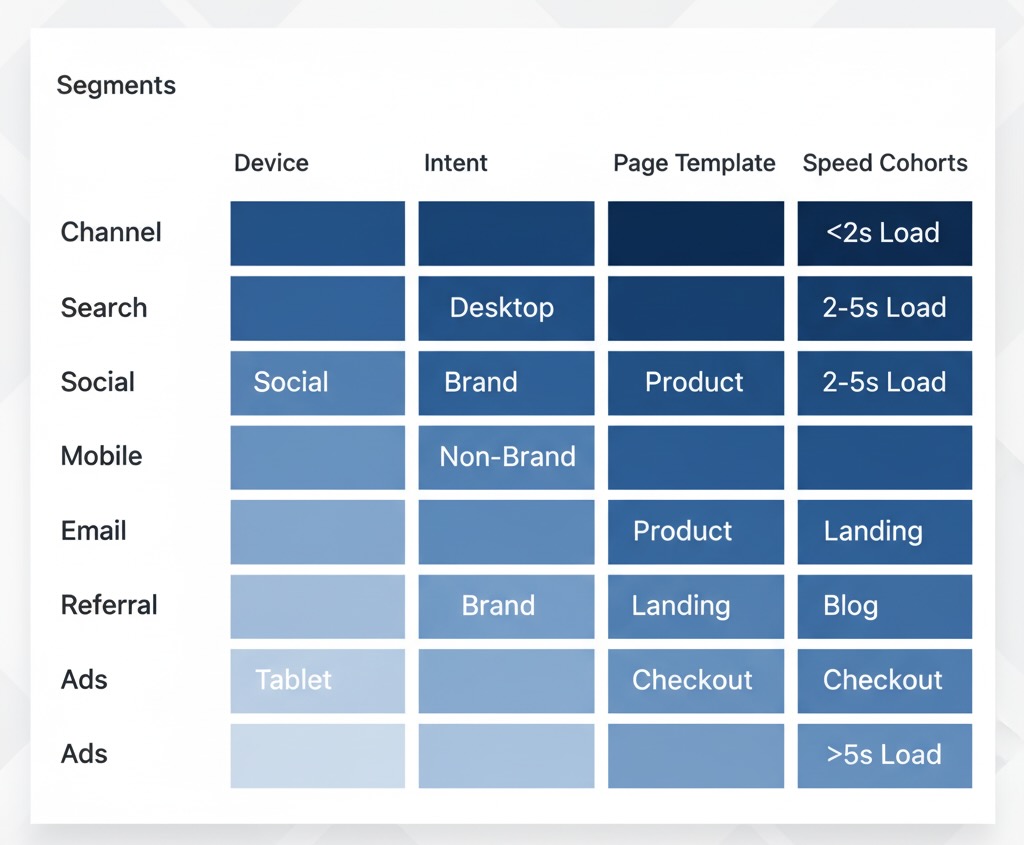
Before drawing conclusions, slice the number. Conversion rate is a blended metric; segmentation turns it into a diagnostic.
Segment by:
- Acquisition: campaign, channel, keyword, creative.
- Audience: new vs. returning, logged-in vs. guest, geography.
- Device & speed: mobile vs. desktop, Core Web Vitals cohorts.
- Context: landing page template, product category, price band.
- Intent: brand vs. non-brand, content vs. commercial pages.
You’ll often find that one or two segments pull the blended rate down. Fixing those can lift the total without touching your star performers.
What to do next: a decision framework (no implementation required)
Use this three-part lens to decide your next moves:
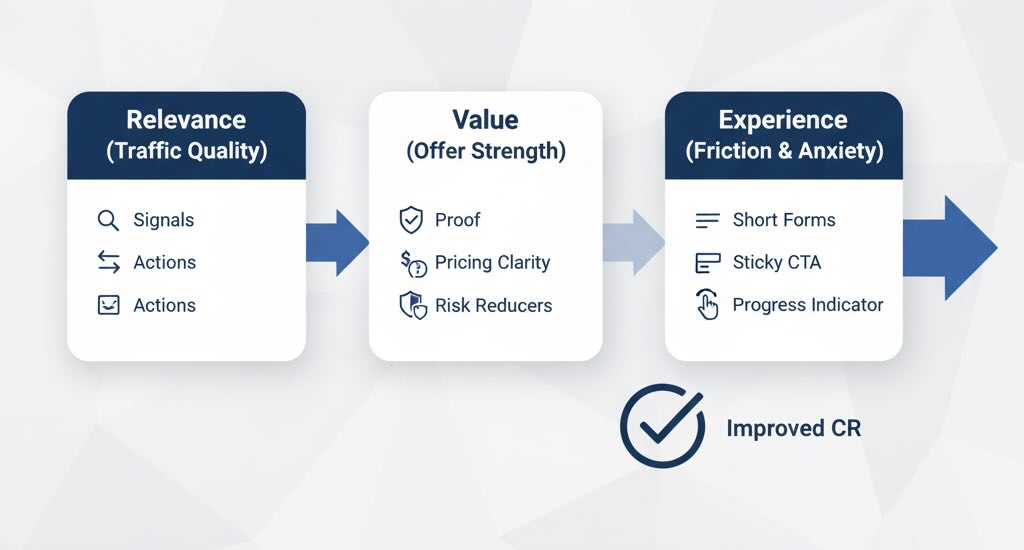
1) Traffic quality (Relevance)
Ask: Are we attracting people who actually want what we sell?
Signals of poor relevance:
- High impressions and clicks but low time on key pages and near-zero micro-conversions.
- Paid social outperforming on clicks but underperforming on add-to-cart, compared to brand search.
What to do:
- Tighten targeting and creative so the promise matches the landing page.
- Align keywords, ad copy, and hero messaging; remove vague headlines that dilute intent.
- Shift budget from low-intent segments to proven ones until you fix the message.
2) Offer strength (Value)
Ask: Do we give a compelling reason to act now?
Signals of a weak offer:
- Traffic engages (scrolls, reads) but stalls at pricing or plan selection.
- High “add to cart” but low checkout completion due to sticker shock, unclear value, or fees.
What to do:
- Clarify the value proposition in plain language: outcome, proof, and differentiator above the fold.
- Add cost transparency (shipping, fees) early; show risk reducers (free returns, SLAs, security badges, guarantees).
- Reduce decision fatigue: fewer plan choices, a default recommendation (“Most teams pick X”).
3) Friction & anxiety (Experience)
Ask: What makes action feel hard or risky?
Signals of friction:
- Drop-off at specific fields or steps; rage clicks; back-and-forth between cart and product.
- Mobile users with higher product views but lower checkout starts.
What to do:
- Shorten forms; make optional fields truly optional; delay account creation until after success.
- Support decisions with micro-copy near critical fields (privacy, payment security, cancellations).
- Keep momentum: sticky CTAs, inline validation, and a visible progress indicator for multi-step flows.
Use micro-conversions to locate the leak
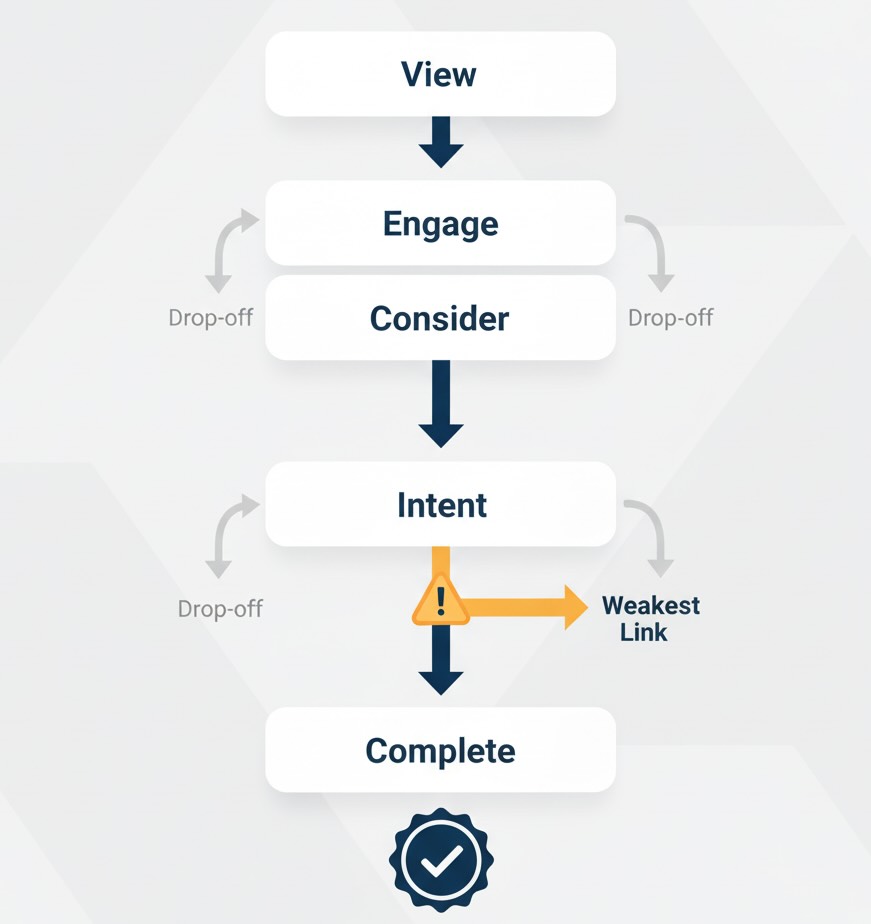
Tie each funnel stage to a rate:
- View → Engage rate (hero clarity and information scent)
- Engage → Consider rate (specs, pricing visibility, social proof)
- Consider → Intent rate (add-to-cart / start trial / request demo)
- Intent → Complete rate (checkout or form completion)
A dramatic drop between two adjacent stages points to a concrete problem (e.g., offer clarity vs. checkout friction). Fix the weakest link first; it typically yields the biggest lift in website conversion rate.
Guardrails for interpreting the number
- Sample size & variance: Don’t chase noise. Small daily swings are normal; run weekly cohorts and review rolling medians.
- Seasonality & promotions: Compare like with like (same period last year, same promo cadence).
- Bot/internal traffic: Filter both, or your denominator inflates and the rate sinks artificially.
- Attribution consistency: Keep your window, denominator, and conversion definitions stable across reports.
Turn CR into a business conversation
Numbers are persuasive when they imply dollars. Frame conversion work this way:
- Impact: “A +0.5 pp lift on mobile checkout adds $X/month in gross profit at current traffic and AOV.”
- Confidence: “We saw the lift across three cohorts and two device types.”
- Next step: “We’ll extend the winning pattern to the top five mobile templates.”
That’s how what is website conversion rate becomes a strategic lever, not a dashboard ornament.
FAQ (quick clarifiers)
Is there one “right” formula?
Use the simplest correct one for your decision, document it, and keep it consistent. If needed, report both user- and session-based CR, but don’t mix them in the same trend line.
Should we optimize micro- or macro-conversions?
Both—but prioritize the stage with the biggest revenue impact. A 10% lift in checkout completion usually beats a 10% lift in scroll depth.
Where do the keywords fit?
In your reporting clarity. When teaching the team how to calculate website conversion rate, show the exact numerator and denominator for each funnel stage. Clarity beats complexity.
Define conversions that matter, calculate the rate with a consistent denominator, segment before you judge, and act on what the segments tell you—tighten relevance, strengthen the offer, and remove friction. When stakeholders ask, “what is website conversion really doing for revenue?”, you’ll have a precise, business-backed answer.